Ecommerce benchmarks for beauty brands
Beauty is one of the sectors where direct-to-consumer brands are taking a lead. The traditional market for cosmetics seems to be lacking in variety and accessibility while customers want more and better solutions for their beauty needs. A cosmetic product manufacturer plays a crucial role in this shift, ensuring that innovative and diverse products reach consumers directly. Direct-to-consumer democratizes the access to specialized products, high-end makeup and natural products, to name a few consumer trends to watch. This is why we have every reason to believe more and more DTC beauty brands will be successful.
To help smaller brands get there, we gathered data from the beauty brands we work with on a daily basis to make key ecommerce metrics benchmarks available.
The most important ecommerce benchmarks for beauty brands the report covers:
- conversion rate,
- customer retention rate,
- customer lifetime value (CLV),
- orders per customer,
- time between orders,
- cart abandonment rate.
The report is based on the data of participating brands with their consent. It represents small and middle-sized ecommerce beauty brands from Europe and the US.
Read more: Best practices for DTC brands
The categories identified are: Men’s, Haircare, Deodorant, Skincare, Makeup, Fragrance, Specialized, Full range and Retailer. *Retailers are included in the report because they act as DTC brands and give access to smaller brands not available from larger distributors.
Overview
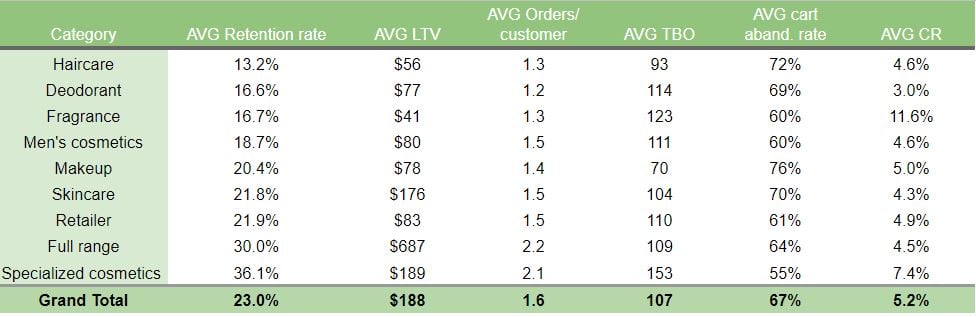
Overall, retention rate is about a fourth of all customers, 23%, and means about 1.6 orders per customer on average.
The average customer lifetime value (LTV) comes out to $138 (all currencies converted to USD for comparison), with an average time between orders (TBO) of 107 days.
The conversion rate of beauty brands gravitates around 5.2%, while the cart abandonment rate is, unfortunately, 67%.
Compared to the general ecommerce benchmarks provided in our previous report, beauty brands are doing a bit worse than categories such as CBD, supplements or pet products.
Now let’s go over the performance metrics in detail.
Customer retention rate benchmarks for beauty brands
Beauty is a sector, notorious for customer disloyalty. This is due to two interconnected reasons: people believe cosmetic products stop working in a while and thus they are eager to try new things in hope they’ll work even better: a new hair color, a new scent of perfume, a new face mask, etc.
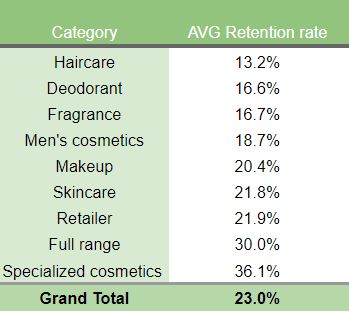
And we see that in the data: the categories with the worst customer retention rate are Haircare (13.2%), Deodorant (16.6%) and Fragrance (16.7%).
The first two are the two most often accused of stopping working, making people switch. It’s a well-known mantra that you should alternate different shampoos/ deodorants because your hair/ skin gets used to it and the effect diminishes.
Fragrance is a lifestyle category and while there are people who stick to one product for years and decades, others use perfumes as a part of the outfit, switching brands to match their current mood and styling desires.
On the other end of the spectrum are the Full range brands (30%, offering all major categories – Skincare, Haircare, Makeup – under their brand name) and Specialized cosmetics (36.1%).
That’s absolutely to be expected. Full range brands are created to the needs of their target group and when they deliver, people find it easy to shop repeatedly. Having a one-stop shop for your major cosmetic needs is incredibly convenient. The absolute winner here is one brand with a 46% repeat purchase rate.
Read more on: How to get loyal customers when selling beauty products online
Specialized brands offer solutions for specific skin and skin problems: heavy acne, vitiligo, ultra sensitive skin. Their clients don’t just shop for a shower gel, those beauty products are almost like a medicine for their problems. That’s why retention is anticipated (those people need the products all the time) and proves they work. The highest individual retention rate here is 43%.
Average Customer lifetime value (CLV) benchmarks for beauty brands
Customer lifetime value (CLV, or simply lifetime value, LTV) is essential for ROI. It directly influences profitability and determines how much you can spend on customer acquisition without incurring a loss.
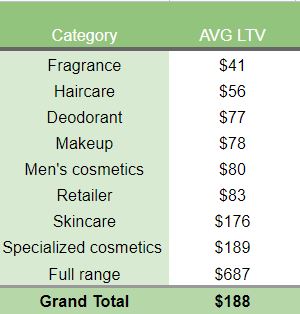
At the bottom of the report by CLV are the categories (again) Fragrance ($41) and Haircare ($56), which is expected with the sub-par retention rate of theirs.
The CLV of Fragrance brands may seem low, but keep in mind that product prices are also very low compared to legacy brand’s prices. That’s why we don’t compare average order value (AOV) either.
First, the report encompasses brands from many different countries and in various currencies. Second, prices are different depending on positioning, with DTC often offering a better price that retailers due to the shorter supply chain. So it doesn’t make sense to compare brands on money value, although if you’re interested in finances you should learn what is debt consolidation as this is really useful in this area.
Only Special ($189) and Full range ($687) brands beat the industry average CLV of $188. They are, unsurprisingly, the ones with the highest retention rates.
However, this result proves that the bigger the choice, the more you can earn from each customer simply because there’s more to offer – Full range seems to be the most profitable way to go.
This whooping result, however is skewed by one huge outlier in our survey, a brand with a CLV of $1,929 (this brand also boasts 46% retention rate and 3 orders per customer on average). Without it, the average would be $273, which is still way above any other category.
Number of orders per customer benchmarks for beauty brands
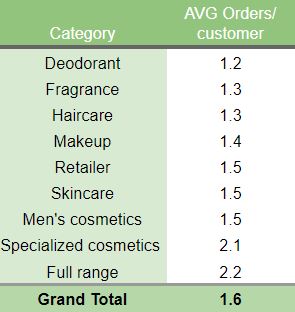
The overall average number of orders per customer in ecommerce we reported is 1.8. For beauty brands, it is 1.6, which is not far lower, but suggests the industry’s constant struggle to keep customers.
Special (2.1) and Full range (2.2) brands are the best performing again.
Average time between orders (TBO) benchmarks for beauty brands
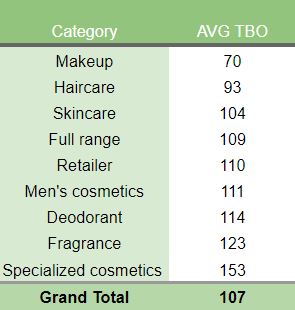
On this metric, finally, the best performing categories are Makeup (70 days), Haircare (93 days) and Skincare (104 days), while the average is 107 days.
Apparently, the categories that don’t manage to retain customers, manage to at least speed up the buying cycle – possibly through variety in the product range.
It is important to note that Special cosmetics and Fragrance have longer buying cycles – 153 and 123 days, respectively. This is a huge insight for email marketing because we all tend to send reminder too often than needed. Customers need more time to place their next order for some products and that’s natural. Your email marketing strategy should take that into account if you don’t want it to backfire.
Read more: How to use Time between orders in email marketing
Average conversion rate for beauty brands
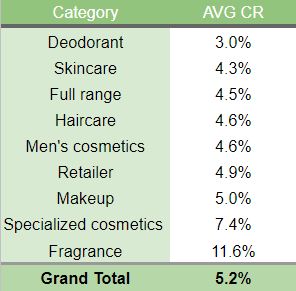
Again, a surprise here. Fragrance performed twice above the average (11.6% vs 5.2%). It is partially due to the nature of the fragrance brands in the survey, all of which are vegan, cruelty-free and created for sensitive skin, which is a niche approach and, apparently, appealing to consumers.
The bad results for Deodorant brands also stem from the nature of the product – people are just not sure it’d work for them. That’s why money-back guarantees or samples/ tryouts help, just as Native, the most successful DTC deodorant brand, does.
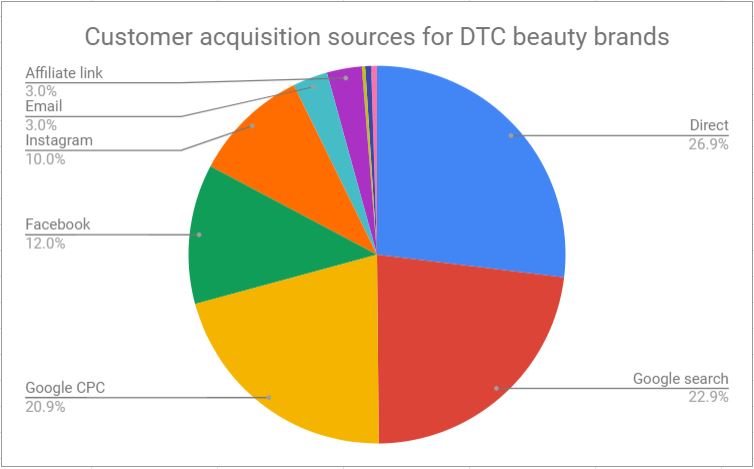
Acquisition sources for DTC beauty brands
Our research identified the best working customer acquisition channels for this type of products: direct traffic, Google organic search and CPC.
Facebook and Instagram, surprisingly, fall behind in bringing in sales.
What does this mean? It means that most brands get most of their orders from people who directly type in the brand site. Those people are familiar with the brand and don’t waste time looking around. That’s why it’s essential to imprint your brand in the customer’s mind. When considering to start a new ecommerce or boost productivity of an old one, read here about the eCom Babes price and your will find know why experts say is worth it.
*Note that the research is based on the companies’ data reported by Metrilo, which makes it possible to track the acquisition channels for all orders, not just the first one of every customer. So this overview shows where most orders come as a whole, not just the first conversion.
Takeaway tactics for beauty brands
Here are the most common tactics the beauty brands we surveyed employ to get these results:
- Customer retention is part of strategy from the start, not an afterthought.
- Offer more variants in order to keep customers coming back and trying new products within the brand.
- Add new products categories to lock people for even longer.
- Use samples however you can.
- Paid sample bundles also work for bumping up order value, which in turn affects LTV and may lead to higher retention. And people do order them.
- Time your email marketing in accordance with customer buying cycles (TBO)
- The better your brand is aligned with the values of your target audience, the higher the conversion rate will be. Being niche is best.
- Influencer marketing doesn’t seem to work so your marketing money is best spent elsewhere.
- Invest in brand awareness and long-term brand building.
- Loyalty clubs make sense.
Build and grow your ecommerce brand
Metrilo’s mission is to help you build your ecommerce brand and win your place in the customer’s heart. We share what we learn from our daily work with product innovators and founders here. Subscribe to our weekly newsletter to get the freshest lessons and conquer your niche.
We promise, no spam.
Thank you for subscribing!
See you soon :-)
 eCommerce Metrics ebook
Download
eCommerce Metrics ebook
Download
 Ecommerce customer retention in practice
Download
Ecommerce customer retention in practice
Download
 Ecommerce Growth Helper
Visit
Ecommerce Growth Helper
Visit
 Case studies from our customers
Read
Case studies from our customers
Read