Report: Customer retention & DTC brands
Metilo’s focus is customer retention. We help you build long-lasting and profitable relationships with your customers and grow sustainably from there.
That’s why it’s important for us to share the good practices in customer retention. Consulting our clients, we have been able to see first-hand what works in different product categories and how retention fits in the big picture of business.
This report presents DTC metrics and customer retention stats from our consulting work with direct-to-consumer brands, summarizing it by categories so benchmarking yourself is more relevant. The brands included are niche, DTC, and long-term oriented, meaning they consciously work for retention and optimize their marketing using all our tools. We also highlight the best customer retention strategies employed.
Let’s go over it.
Retention metrics covered
- Customer retention rate (new vs returning customers share)
- Revenue share from returning customers
- Average time between orders
- Average number of orders per customer
- Average customer lifetime value
The overall data looks like this:
*Money values are in US dollars to unify data from across countries and currencies.
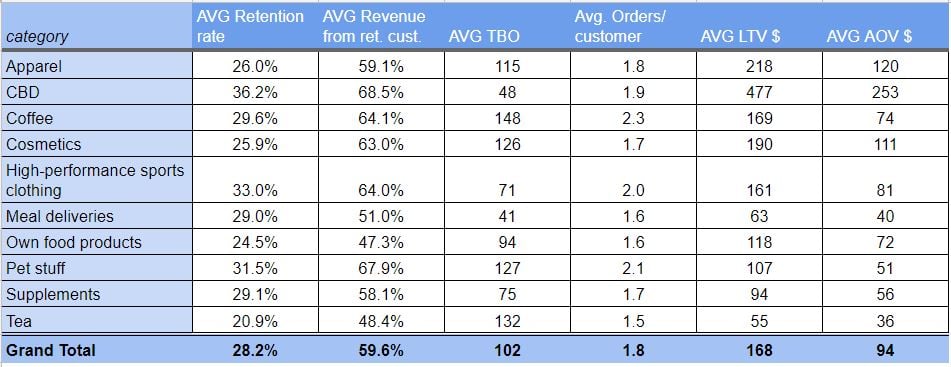
Our sample of 65 businesses reaches an average retention rate of 28.2%. That means on average 28% of customers place more than one order with a certain shop.
Also, overall, almost 60% of revenue comes from old customers as opposed to new (first-time) customers.
Time between orders is a metric that can vary hugely from product to product, which can be seen in the table. Meal deliveries get ordered every 41 days on average while coffee for home – every 148 days on average.
The number of orders per customer ranges from 1.5 for tea to 2.3 for coffee. Interesting! Maybe it has to do with the fact that most tea brands in the sample are detox-oriented, which means they are not a staple like coffee but only consumed temporarily.
As for LTV and AOV, CBD is the clear winner (we work only with CBD businesses that operate in regions where CBD is legal).
Now let’s go over the most interesting categories and their DTC metrics.
Retention in the Apparel category

In this category, it is clear how customers are willing to spend more after the first order has gone well.
Naturally, the first order is a test of the quality, fit and so on of the clothes, but once quality is proven, they are happy to order again – almost 60% of revenue comes from returning customers although they are 26% of all buyers.
*The average LTV and AOV may seem low, but keep in mind the report includes brands from very different countries where standard prices may differ widely.
Tactics used
We’ll highlight the most interesting and effective tactics the brands employ to drive customer retention.
Unique experience
One of the fashion brands lets customers choose a discount at checkout from a range up to 35% off. If a customer chooses to pay the full price, delivery is free. This simple trick gets them the highest share of revenue coming from return customers in our report, 73%!
Hyper niche
Another brand makes Paris-inspired clothes for plus size women, which is something quite specific and targeted. The brand is born out of a personal need of the founder to find such clothes and it obviously attracts others as retention rate is as high as 36.7%.
Involve customers
If you want to make clothes people love, ask them what to make – that’s the philosophy of another fashion label we work with. They post new designs on Instagram and let fans choose which ones get made. Customer engagement is sky-high. This drives purchase frequency to a category-low of 78 days as people are eager to get the style they voted for.
Retention in the CBD category

This category holds the record for the highest retention rate, 36.2%, in our report. Buyers of CBD oils, liquids and other such products turn out to be very loyal to their preferred shops, making them as much as 68.5% of revenue. Also, the AOV and LTV can make other product categories jealous.
Tactics for retention employed by CBD brands
Email engagement
Since there are still strict regulations on advertising CBD products, those companies have to rely on under-the-radar communication channels like email. Most big CBD shops have professionally done email newsletters with useful info on the different kinds of products. We see email drive as much as 40% of sales to existing customers (once they get the email contact).
Product quality
In such a sensitive industry where many people use the product for medical reasons, cbd wholesale suppliers quality appears to be a driving force. The absolute winner in the category – a shop with the insane 52.7% retention rate and 94.5% of revenue coming from repeat customers, receives raving reviews about the freshness, safety and taste of its product.
Variety
For the more adventures audiences, such as the users of CBD products, variety in forms and methods of intake matter. The brand with the lowest time between orders manages to get an order from each customer roughly every 42 days thanks to a huge product range for different needs. They also feature video testimonials on YouTube, and other user-generated content as way to showcase those different uses – for pain relief, curing insomnia and so on.
Retention for online coffee stores

Coffee is a staple good in many homes so it’s naturally a retention-oriented business. Our clients consistently find direct offers and take-it-or-leave it approach to work best because you either need coffee now or don’t.
Retention strategies
Replenishment reminders
That’s why properly timed reminders to get a new pack of morning brew work great in this category. People don’t want to run out of coffee. Our clients use the metrics time between orders to calculate the right time to send a reactivation email just when it’s needed. A coupon only helps the conversion.
Samplers
The best performing brands care about the taste and ethics of their coffee. They often offer sampler sets to new customers to help them choose the blend they like, thus creating a positive experience and stimulating loyalty.
Seasonality
If you sell coffee online, too, don’t underestimate holidays. Some of our clients discovered that coffee makes a great gift and their holiday sales are the peak of the year. A quick revenue trend analysis can show if you’re missing out on opportunities as well.
Case study: How Barrington coffee acquires and retains customers
Customer retention for cosmetic DTC brands

The cosmetics industry is notorious for its low customer loyalty and deal hunting. The big drugstore brands rely almost exclusively on discounts in a zero-sum game: whoever has the best price for shower gel this month, wins the largest market share.
Read more: Best practices for DTC beauty brands
DTC brands, however, are different, differentiated actually to cater to specific needs and customer groups. They cannot and don’t want to compete on price. That’s why they manage to rack up the amazing 25.9% average retention rate and 63% in revenue from loyal customers.
Tactics DTC cosmetics brands use for retention
Very niche and quality-driven
The successful DTC cosmetics brands start out as solution for very specific problems – skin conditions like vitiligo or allergies, ultra sensitive skin, skincare for rough climate, or for ethical reasons – like vegan perfumes, for example. The brand with the astonishing 42% retention rate makes cosmetics with a special ingredient that fight problem skin and inflammations.
Backed by science and authority
Those brands employ science to develop better and effective products that attract eager and sometimes even desperate for a real solution customers. Often they work with an expert chemist or a medical doctor to ensure their products really work.
Start small
The nature of such products makes it ok, if not expected to start with a small product range. It shows care in the development of the products. It also helps create brand awareness as early adopters remember the brand for its focus on the core customer problems, not blurred by hundreds of products.
More infomation: https://kasynoonline.ltd/
Retention among high-performance sports clothing

This category consists of brands that make and sell their proprietary clothing for specific sports. This includes high-tech running tops, large size workout clothes for huge bodybuilders, body-positive gear for strong female athletes, etc.
Given the category specifics, it’s no wonder the average retention rate is one-third! And the short time between orders, 71 days only, means those brands manage to make their customers happy.
Tactics to steal
Authenticity
All brands in the report talk to their target audience only and ignore anyone who doesn’t fit the ideal customer. This means inside jokes and slang, friendly motivation and creating the overall feeling that these people know what they’re talking about. One brand has such a strong community that they organize their own conference/ motivational meetup.
Heavy content
Not surprisingly, the best reorder frequency is achieved by a brand that creates high-quality workout content. The category can make huge use of content on all social platforms as well as on site – video, downloadables, interviews, even interactive menu/ workout customer tools.
Customer retention for meal delivery businesses

Meal deliveries are a tricky business. Usually, they work as one-off or subscriptions for cooked meals. Some offer custom menu options for the week. The focus is on healthy, freshly prepared food.
While the category results are not that exciting as others, we include it to show that those brands still have work to do. One best practice we want to mention is:
Highlight deals
Since customers can order either one meal or a daily/ weekly meal plan, the desired option (maybe weekly plan) is best highlighted to draw the attention and increase order value. One such order is worth 7 individual meal orders with one delivery, which improves profitability and prolongs the customer lifespan.
Food brands stats report
Build and grow your ecommerce brand
Metrilo’s mission is to help you build your ecommerce brand and win your place in the customer’s heart. We share what we learn from our daily work with product innovators and founders here. Subscribe to our weekly newsletter to get the freshest lessons and conquer your niche.
We promise, no spam.
Thank you for subscribing!
See you soon :-)
 eCommerce Metrics ebook
Download
eCommerce Metrics ebook
Download
 Ecommerce customer retention in practice
Download
Ecommerce customer retention in practice
Download
 Ecommerce Growth Helper
Visit
Ecommerce Growth Helper
Visit
 Case studies from our customers
Read
Case studies from our customers
Read