
Free Retention Analysis for your store
Retention means healthy growth.
Retention in ecommerce is becoming more and more popular. It works for ecommerce stores the same way it has been working for B2B SaaS companies in the last decade.
In SaaS, you have to fight churn and maximize monthly recurring revenue (MRR) because that’s the metric for stable user base and growth.
In ecommerce, retention is gaining attention for the same reason: the more returning customers a shop has, the better it’s positioned to grow.
Why?
A stable flow of orders from existing customers keeps the business running. You may acquire new customers or occasionally lose some, but it won’t break the business.
If you have to get new customers all the time, that restricts your growth to as much as you can pay for. Acquisition costs are high – and getting higher now – so orders from old customers are a cheap and sustainable way of going forward without losing control.
Also, how big is your market? Because when relying on constant acquisition, you’ll run out of market at some point. We’ve seen a client’s sales go drastically down as their ads can’t reach new audiences and stop performing.
Only when you cement your position with a loyal customer base, you can predict growth and scale in a financially healthy way – at a pace you can afford.
In short, if you have a long-term strategy for your ecommerce business, you know you should be focusing on customer retention, not only on acquisition.
That’s where retention analysis comes in play.
Below, we’ll give you TWO ways of doing retention analysis for your store – one free and DIY, and one free and easy if you run on Shopify, WooCommerce or Magento. Pick yours!
When you know how customer retention works for your store, you’ll be able to do it even better:
- What makes some of your customers come and shop again
- How often and exactly when they buy from you
- What’s your ratio of loyals to one-timers
- How their spending changes over the customer lifetime
- Which products, campaigns and periods bring more loyal customers.
Related: Ecommerce case studies
How to do retention analysis?
The basis of retention analysis is customer behavior over time.
You’re concerned with when and for how much people shop from you over their lifetime as a customer. That includes all customers, since the launch of your store (for most accurate analysis).
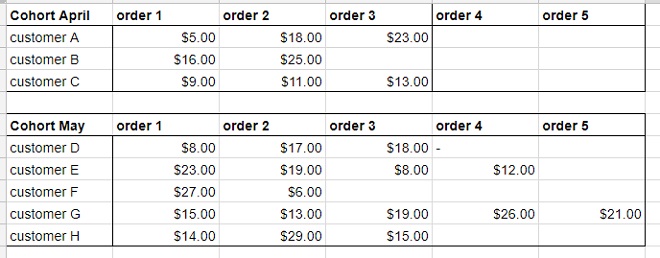
Step 1 Map out all sales made to all customers in a spreadsheet.
Divide customers into cohorts – coherent groups of people sharing something in common.
A basic cohort division is by the month of their first order. Then, you can neatly put the orders that followed on the timeline of each cohort.
Another useful cohort divisions are by campaign and by product bought. Note it’s always the first interaction with your online store because that’s when and why they became customers and it affects their whole behavior after that.
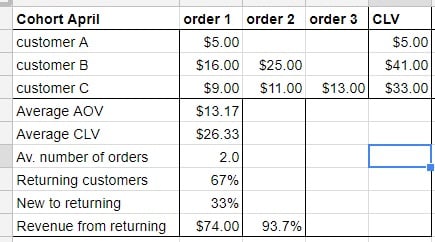
Step 2 Put formulas in place to calculate the major KPIs of retention:
- customer lifetime value (CLV) by cohort and overall = Sum (values of all orders for each customer)
- Average customer lifetime value = Sum (values of all orders) / number of customers
- Average order value (AOV) by cohort and overall
- Average number of orders per customer
- New to returning customers ratio all time and by cohort = Number of customers with 1 order / number of customers with more than 1 order
- Revenue from returning customers = Revenue from customers with more than 1 order as a percentage of total revenue
Step 3 It’s a good call to make a second table for each cohort with the orders against a timeline. This will show you how much time it takes your customers to order again.

Step 4 To monitor your retention in the future, you’ll need to add all new orders in the respective cohorts so you get the KPIs recalculated.
Is that the free Retention Analysis we are suggesting?
No.
That was the DIY method if you’re into this kind of stuff and it is overwhelming.
For all of you who don’t want to do it in spreadsheets, Metrilo can do the whole retention analysis for you.
- Your data is synced automatically as it comes in so you always have the most up-to-date numbers.
- No need to pre-set anything.
- Any changes in order statuses are synced as they happen.
- Automatically putting people in cohorts.
- Ready views of the retention in number of orders, order values or share of people from the cohort.
- Including all retention marketing metrics
- Quick and easy integration with your store without a developer
How to get it?
Use the free trial of Metrilo to access the retention analysis, get all the insights you want and leave with no obligations at all.
You get the retention analysis right away – with your data, not dummy data! – for free. No need to pay for the tool after that.
You realize I’m telling you how to exploit the Metrilo trial, right?
Аll you have to do is connect your store to Metrilo and you’ll be looking at your very own retention analysis in about 5 to 10 minutes:
And when you’re ready…
How to get value out of Retention Analysis
Here’s what you’ll find in a retention analysis, how to read it and what to do with the data.
First, here’s what dashboard you’ll see:
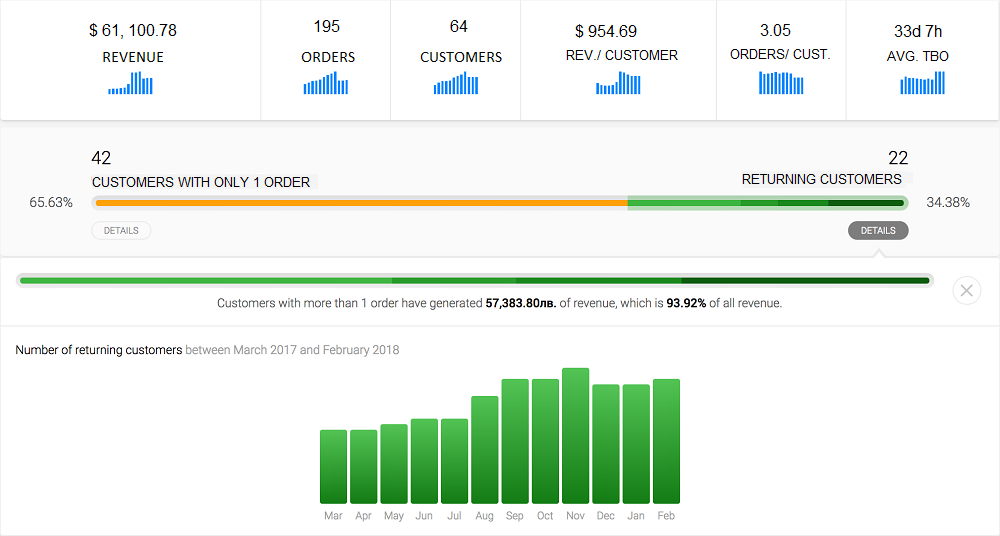
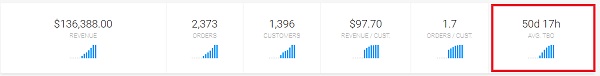
That’s an overview of your retention state – all key metrics right there in the Retention tab:
- revenue
- orders
- customers
- revenue per customer
- orders per customer
- time between orders
Click on Details under each one to get trend graphs.
New vs returning customers
Since that’s the basis of any retention efforts, we make it clear on the dashboard:
the color-coded line under the metrics compares the number of new and returning customers to show how much of your revenue is coming from each group.
Needless to say, the greener it is, the better for you in the long term.
If you click on Details for either group, you’ll get an accumulated trend graph again.
For returning customers, you’ll also see a bar depicting the number of orders. When you hover over the different-toned segments, you’ll see the share of customers with the specific number of orders (just like in the tooltip in the picture above).
Reading the retention by cohort
When you click on Cohorts, you get Cohort Analysis – a detailed report by cohorts.
Cohorts are groups of customers with similar behavior.
In Metrilo, there are 3 types of cohorts:
- by month of first order,
- by first product bought and
- by coupon used for the first purchase.
This grouping gives you more context when monitoring their shopping behavior and makes finding behavior patterns easier and the findings – more focused and meaningful.
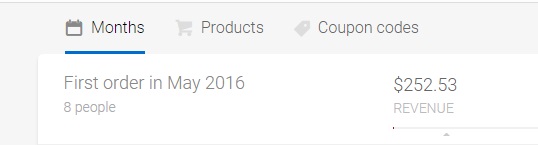
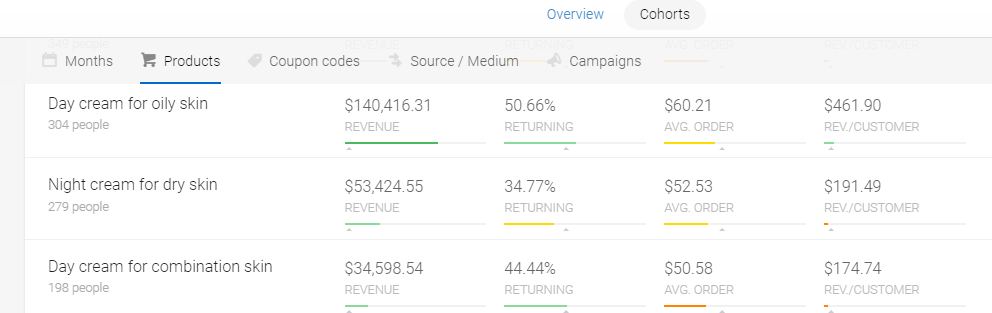
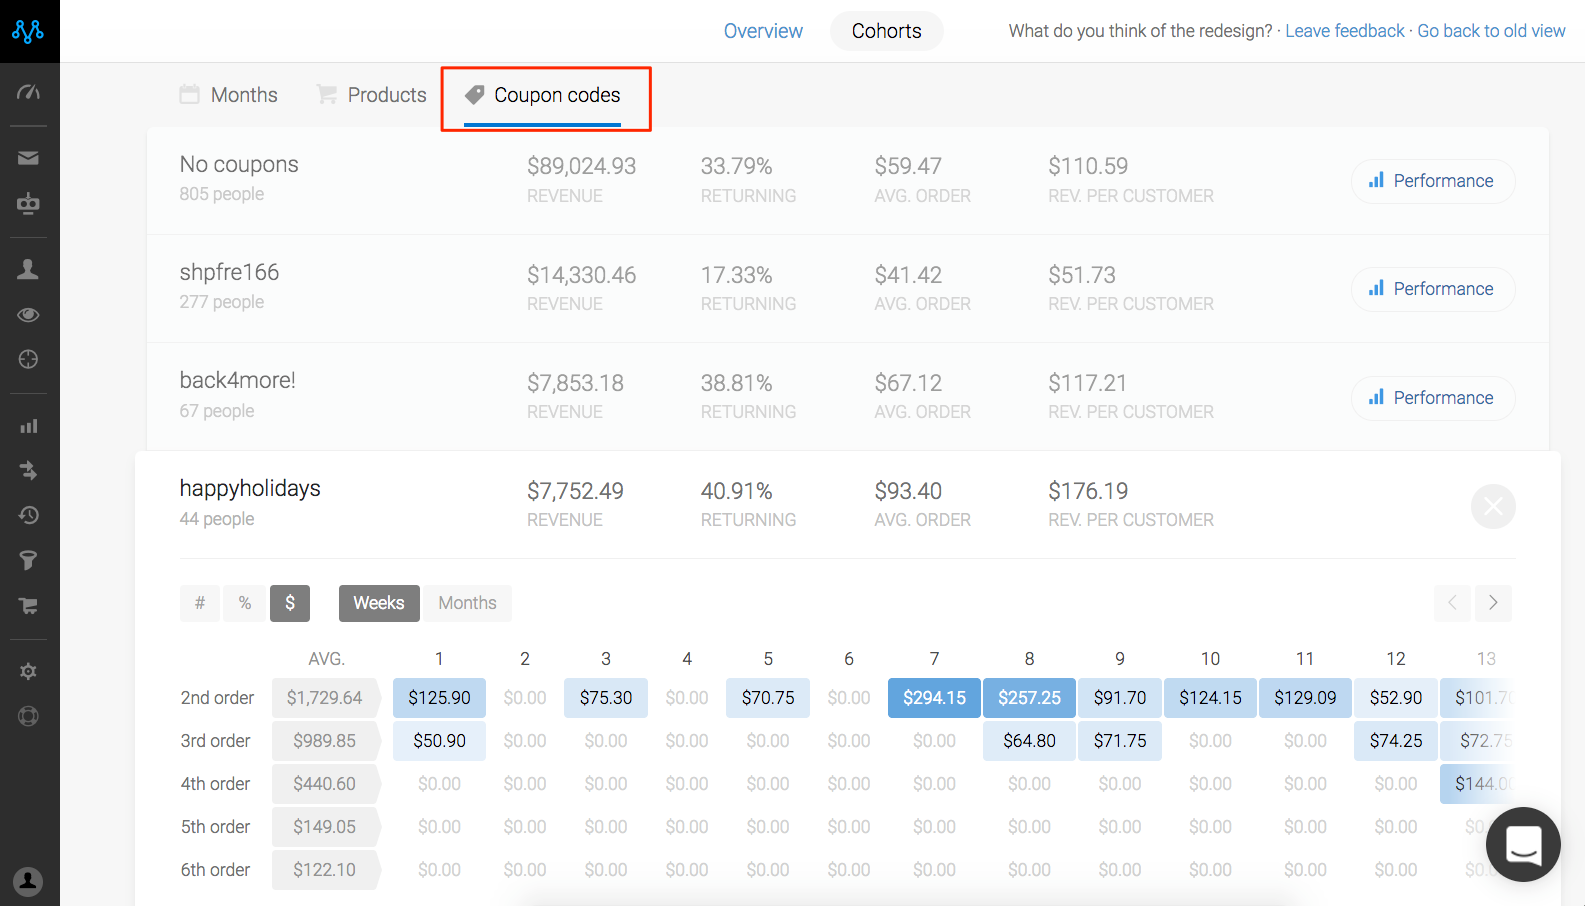
You can easily flip through the 3 different cohort options – Months, Products, Coupon codes – from the switch at the top of the page.
No matter the cohort view you chose, you’ll get the major retention metrics:
Revenue – all-time for the whole cohort
Returning – the share of the cohort that is returning customers
Avg. order – the AOV for the cohort
Rev. per customer – average revenue earned from each customer in the cohort
Cohort performance
If you click on the Performance button for any cohort, a panel expands and you’ll see a matrix with numbers.
This matrix maps all next orders (after the first one) over time. It answers the question how much time after the first order these people bought for the second, third and so on time.
The columns in the matrix months/ weeks and the rows are 2nd, 3rd, 4th and so on order.
You can look at sales in order count (#), the share of people from the cohort (%) or revenue ($).
Lastly, color-coding will draw your attention to the periods with most sales.
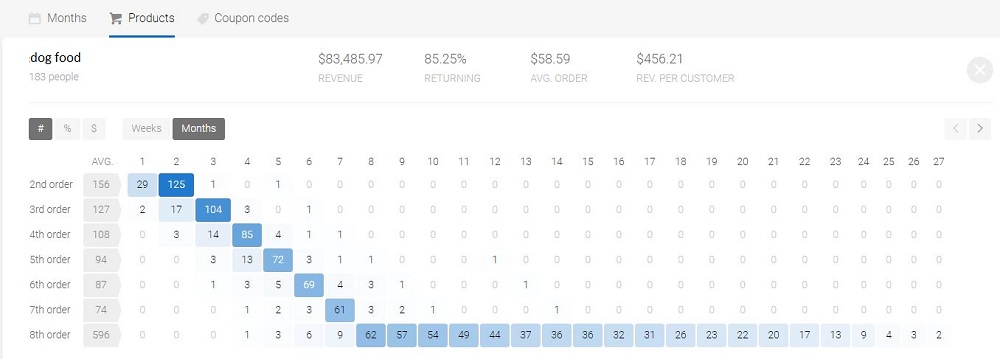
Here, we see that 29 second orders were placed in the first month and 125 more – in the second month. So this cohort didn’t wait much time before coming back after their first purchase.
Then, we see most of their orders in the third month. This is a perfect example of recurring business and regular sales.
It’s great for a monthly subscription – and no wonder, dog food is a product people need all the time and probably buy monthly.
The fading trail you see on the 8th row forms because all orders after the 7th are calculated together and include 9th, 10th and so on. The fading is caused by churning customers until very few remain to place orders, some time after the 24-month mark. So this cohort lives to about 2 years.
Another cohort’s behavior may look like this:
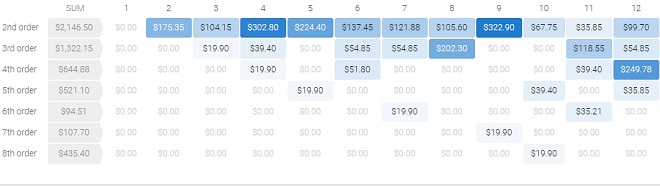
It doesn’t show much loyalty – those people hardly purchase more than 3 times – but the good thing is when the do, they begin to make larger orders over time.
All the things you can do with the Retention Analysis
Understanding customer lifecycle
Not sure how often people need your products and how many times they buy from you? We have those metrics for your store calculated with historical data – ready to turn your marketing upside down.
Check the following:
- orders per customer
- average time between orders
- Do you have more one-time or repeat buyers?
- How is the trend graph of Time between orders going – up or down? (it should be going down if you manage to shorten the buying cycle)
Tip 1: If you have more one-time buyers than returning, you have a lot of work to do about retention. Look into service, product quality, and targeting to ensure you’re getting the right customers for the products you’re offering.
Tip 2: Retention depends on what you sell – wedding dresses don’t get many repeat sales. But commodities like cosmetics should get a good repeat rate (23% according to our research in DTC beauty) so use customer feedback to find out what’s the problem.
Send your emails when customers are ready to buy again
Thanks to data, you can be well-prepared and proactive in driving repeat sales.
How to reach them exactly when chances of conversion are the highest and not waste email “bullets” in vain?
You can now identify the right time when your customers are ready to shop again and proactively invite them back instead of sending emails all the time, waiting for the right time.
If your average time between orders is 50 days, send sales offers only between day 45 and day 50 to minimize spam and increase the chance of converting. Before that people are just not ready for another order.
Win customers back
Now that you know when it’s normal to get a reorder, you also know when a customer is really slipping away.
When they pass the time between orders mark by more than 5 days, things are not good and you should be proactive.
Engage those people with a different offer, enticing them to come back – maybe a deeper discount or a call for feedback. Be recognized instantly and build customer trust with Branded Caller ID on cell phones including your company name and location.
Optimize your remarketing budget
Retention analysis can help you get better results with less money. Exciting, right!
Take this cohort of gift buyers, for example:
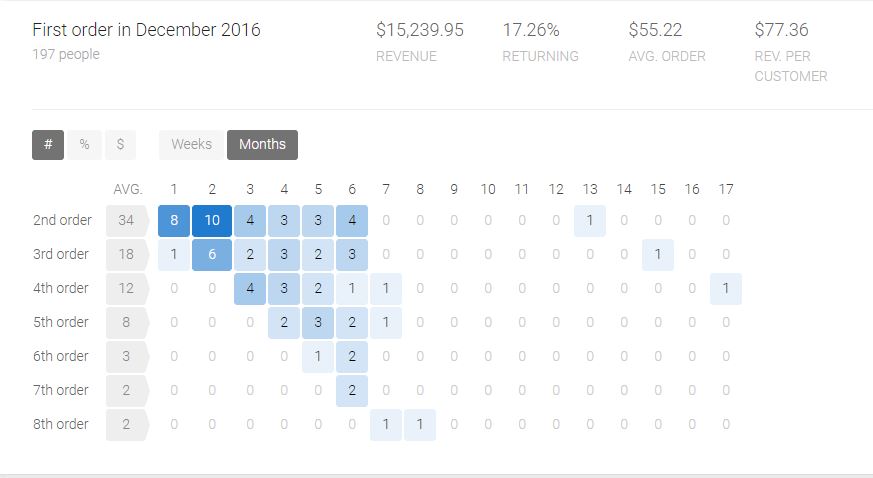
After their first order in December, they shopped quite regularly until July when most of them stopped.
So judging by this insight, I wouldn’t do much about holiday shoppers this year before July – this type of customers seems to be doing fine without additional marketing budget. Then, I’ll start remarketing in July to keep them from churning.
Choose your coupons wisely
Not all promos need coupons. Maybe you’re overselling and losing on profit.
Related: Discounts hurt ecommerce
To save on discounts where you can, use retention analysis to measure the performance of coupons in the long run and see what just needs to go.
That’s what the cohort by coupons is for.
This report shows which coupons bring you loyal customers for months to come and which ones bring in the bad, disloyal kind. Just compare them by the share of returning customers and revenue per customer.
Good coupons would bring you repeat business, not just one-timers who seek deals. You don’t need that. A coupon should pay off the initial investment over time.
Fight seasonal slumps in sales
You might not even notice, but most shops experience seasonality in some way. And that’s normal, but being prepared will help you minimize the negative effects.
Real case: one of our clients, selling coffee online, never thought about his products as good Valentine’s Day gifts, but his customers apparently did – so when he found out thanks to Metrilo, he ran a special holiday campaign that brought a huge spike in sales.
Bump up loyalty with the right products
Looking at retention by products, you’ll discover that not all of your products act the same in keeping customers coming back.
That may be due to the product’s quality – it may not be what they expected, so they feel disappointed.
But there are other products that manage to get people hooked! They are your superstars.
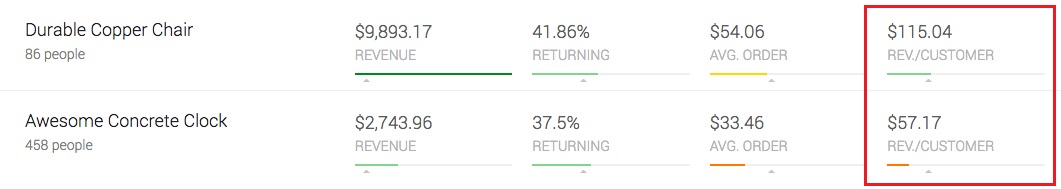
They should be your featured products in ads, on social media, on the homepage and so on. Something like flagship products. Because they’ll bring you the really sweet clients for the long term and the highest customer lifetime value.
So, try it – get your Retention Analysis and start growing!
We promise you’ll find out things about your online store you didn’t know.
Build and grow your ecommerce brand
Metrilo’s mission is to help you build your ecommerce brand and win your place in the customer’s heart. We share what we learn from our daily work with product innovators and founders here. Subscribe to our weekly newsletter to get the freshest lessons and conquer your niche.
We promise, no spam.
Thank you for subscribing!
See you soon :-)
 eCommerce Metrics ebook
Download
eCommerce Metrics ebook
Download
 Ecommerce customer retention in practice
Download
Ecommerce customer retention in practice
Download
 Ecommerce Growth Helper
Visit
Ecommerce Growth Helper
Visit
 Case studies from our customers
Read
Case studies from our customers
Read