
Ecommerce conversion rate fix: stop funnel leaks
Once you have an online business going, you may think at first that all you need to do now is sit back and watch the money rolling in.
However, ecommerce is no different than traditional businesses in that you still have to monitor everything and improve constantly. It’s certainly not passive income.
Finding ways to make things better and earn more revenue is about figuring out two things—what’s broken and what can be improved. It can be hard, though, because not all things in ecommerce are so obvious.
That’s why you must make use of your ecommerce analytics and see if there are leaks in your funnels that can be patched up.
Spotting trouble areas in your conversion funnel
For users of Google Analytics, you should create goals eligible for your funnel. A “destination goal” is the specific web page you consider as a conversion when customers end up there.
With ecommerce websites, that page is usually the final page that shows up when a customer finalizes payment.
Not only should the page say “Thank You” and confirm the transaction is complete, but it must also be set as a destination goal for your analytics.
You should then be able to draw up a Funnel Visualization report in GA. Take note that product pages are meant to be the primary generators of entries into the funnel, although other entry points like landing pages and About pages may also do it. Check the usual checkout flow your customers experience on your site.
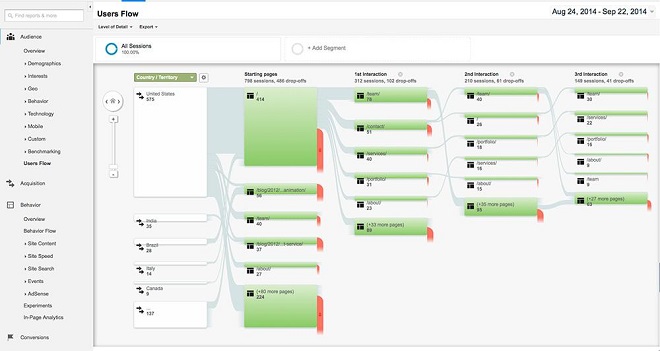
Google Analytics can show user behavior and a funnel visualization of drop-offs on your site. The user behavior feature shows the starting page as well as the 1st and 2nd interactions of visitors.
p3inbound.com
Looking at this feature, you can see the pages where visitors leave. Then, analyze the page and determine what could be the possible causes of people leaving.
Some of the reasons could be:
1.Technical
- page takes too long to load
- images not showing
2.Content
- page content is not persuasive enough make users go on
- the message does not speak to the intended audience
3. Calls to action
- no CTA whatsoever
- CTA buttons or links are not working
The most common reason is the lack or ineffective CTAs of a page. Help guide the visitors by continuously improving and testing the page’s CTAs until the drop-offs become minimal.
webmasters.stackexchange.com
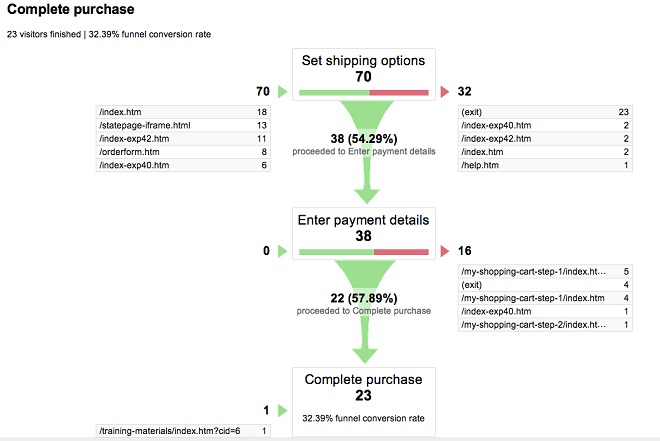
Another feature is the funnel visualization. This shows the flow to the goal path URL that you set in Google Analytics.
It shows the entrance and the exit pages, which is a good starting point for analysis for goal conversions as it shows which pages work and which ones need improvement.
From product or landing pages, you can lead visitors to the cart page, then the page where they enter and/or confirm their shipping and billing information, then to the confirmation page, and finally the Thank you page that’s set as the destination goal for your funnel.
This practical guide to ecommerce conversion rates and funnels has excellent points that can be utilized in increasing conversions.
Using Metrilo’s special ecommerce analytics, it can be easier because there are 3 pre-set conversion funnels. These are product, content and shopping cart funnels.
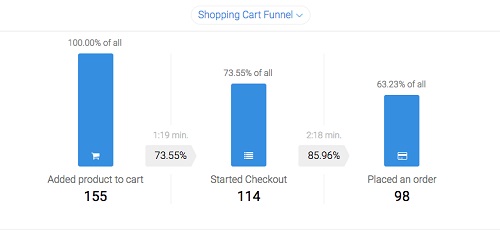
This makes it easier, especially because the group of pages is already segmented and you will have the idea of what the user’s intentions are.
For product and shopping cart funnels, you can see that they are already thinking about buying. They are in the purchasing stage. For content funnels, you can see if the content strategy of the site is optimized for conversions.
What you want to see here are customers being able to proceed through this funnel only when they add a product to the cart.
If this isn’t the usual case, then you’ll find the conversion rates and data from Funnel Visualization to not match up. You should then be able to determine where the leak is from there.
Properly analyzing conversion funnel data
Upon setting up the funnel, wait for some time —around a week or two for high-traffic sites—before you can look up the data.
A month or so is best to gather sufficient data for analysis. Otherwise, it wouldn’t have enough to be of any significant value.
Once it’s ready, open the Funnel Visualization report. You should see the report with three major steps of the funnel highlighted.
If there is a progression that doesn’t seem right, then that’s most likely your problem.
Take traffic sources into consideration
Knowing where your visitors come from can help you focus on the traffic sources that really make a difference for your business.
If you see visitors coming from a traffic source you didn’t expect, you should look into it and figure whether it’s good for your business or not.
How visitor behavior affects ecommerce conversion rates
Examining behavior of individual visitors can uncover ways to improve ecommerce conversion rates and fix leaks in your funnels.
For instance, you may spot faults in how traffic is handled on your site, like problems somewhere in the shopping process. If nothing is outright broken, you may instead find ways to improve the shopping process, making it easier and more efficient with tweaks in design.
Funnel Visualization can be customized to show you exactly what you need to know about your ecommerce website and how visitors interact with it. There are two ways to do it – assisted conversions or multichannel conversions.
Assisted conversions show interactions within given channels that help for the conversions. This is not a completely accurate depiction of transactions since it typically attributes a single transaction to multiple channels. Despite that, this metric is still useful in giving the bigger picture of how visitors find out about your business.
Multichannel conversions have visitors going through one of many channels in order to get to your business. It’s what you get when you cover your bases as well as you can.
While assisted conversions show how things happen in specific channels, this metric is about how multiple channels work together to create conversions.
The most common user behavior metrics are bounce rate, pages per session and average session duration. However, these data should be carefully filtered as it could not show the complete picture.
Examples of this are people’s use of multiple devices to view websites (desktops, laptops and mobile devices). Google analytics also counts sessions even though the user is idle. These are some of the things to consider when looking at the data.
Assuming that you have already cleaned the site data, you have a good estimate on how people behave on your site. By identifying which pages need improvements, you can come up with technical, content or copywriting fixes.
Ecommerce conversion rate optimization with insights from Funnel Visualization
Funnel Visualization can help you specify which parts of your site convert your customers. You also get to know how many who end up in checkout page actually go through with it, which reflects how easy is the buying decision for your visitors.
Making use of conversion funnels to improve your business is all about measuring results and learning from mistakes. That’s the main reason why data analytics, in general, are indispensable for online businesses – there’s no other way to evaluate performance but data.
Actionable strategies for bringing visitors back
It’s about being able to make your site as efficient as possible while also understanding what traffic sources are best for drawing in more customers.
For example, if there is a high bounce rate оn the checkout form, maybe the form asks too much information. Or if the checkout form has 5 pages, it might be too long and you need to use a one-page checkout.
Long loading time can be really annoying for users. It’s really important for mobile sites because it impacts SEO. Some fixes include using CDN to speed up data transfer from servers, optimizing images, JavaScripts, and CSS. Consult with web developers for sure.
Email marketing is a powerful strategy for this purpose. The great thing about it is that it can be a part of every stage of the funnel, from simply creating awareness about your business right down to making customers loyal to your business.
Email marketing is also great for engagement of cart abandoners. Incentives like offering them discounts or promotions will give them the motivation to complete the transaction process. As a bonus, they might see other products and hopefully purchase those too.
There are also other strategies like social media marketing, but email marketing is especially powerful for businesses as the inbox is the most intimate place on the Internet. If you can get customer’s attention through email, you have the best chance to convert them.
Conclusion
Being able to identify what is causing visitors to drop off your website is the way to increase your ecommerce conversion rates.
Thanks to funnel visualization, you’ll know where to start and what to fix.
This article has been contributed by Johann Carpio, an ecommerce marketer with expertise in SEO and content marketing.
Build and grow your ecommerce brand
Metrilo’s mission is to help you build your ecommerce brand and win your place in the customer’s heart. We share what we learn from our daily work with product innovators and founders here. Subscribe to our weekly newsletter to get the freshest lessons and conquer your niche.
We promise, no spam.
Thank you for subscribing!
See you soon :-)
 eCommerce Metrics ebook
Download
eCommerce Metrics ebook
Download
 Ecommerce customer retention in practice
Download
Ecommerce customer retention in practice
Download
 Ecommerce Growth Helper
Visit
Ecommerce Growth Helper
Visit
 Case studies from our customers
Read
Case studies from our customers
Read